I’m running the following droplet at Digital Ocean:
$5/mo
512MB Memory
1 Core Processor
20GB SSD Disk
1TB Transfer
This weekend I have updated most of my stack (except for the Ubuntu, which is still 32bit Precise 12.04)
Now I’m running:
NGINX Stable 1.8
PHP 5.6.12 FPM
OpCache 7.0.6-dev
Varnish 3.0.7
xCache 3.2.0
APCu 4.0.7
So, let’s explore how good is the system and try and use that TB of traffic for testing using load testing by loader.io.
First of all, let’s see how good is the connections to the server, just getting small file in request. I would like to see just NGINX performance, thus using SSL connection to skip the Varnish cache.
Response Times: Average 23 ms, Min/Max 7 / 20015 ms
Response Counts: Success 538007 Timeout 99 400/500 0 / 0 Network 548
Bandwidth: Sent 76.12 MB Received 173.94 MB
Quite impressive number of requests handled, the duration of the test is 60sec, so it comes roughly to 9000 requests per second.
Graphs are linear at first, but then hit some limitations.


First thing I notice is the errors in the log, starting with:
WARNING: [pool www] seems busy (you may need to increase pm.start_servers, or pm.min/max_spare_servers)
spawning 8 children, there are 1 idle, and 8 total children

spawning 8 children, there are 1 idle, and 12 total children

spawning 16 children, there are 1 idle, and 13 total children

spawning 8 children, there are 1 idle, and 17 total children

spawning 16 children, there are 1 idle, and 18 total children

spawning 8 children, there are 1 idle, and 22 total children

spawning 16 children, there are 1 idle, and 23 total children

spawning 8 children, there are 1 idle, and 27 total children

spawning 16 children, there are 1 idle, and 28 total children
Doubling all the PHP children settings:
pm.max_children = 60
pm.start_servers = 8
pm.min_spare_servers = 4
pm.max_spare_servers = 12
Just to confirm that Varnish is handling these:
This time there’s no errors in the PHP log, no timeouts (well, smaller responce times, and a bit less “network errors”):
Response Times: Average 23 ms, Min/Max 7 / 18147 ms
Response Counts: Success 564776 Timeout 99 400/500 0 / 0 Network 405
Bandwidth: Sent 76.12 MB Received 173.94 MB
Graphs look a bit better as well, no dips in the middle, probably caused before by spawning of more PHP child processes, but possibly by some other processes on the server.


These Network errors are not quite “Clear”, as I do not see much explanation as to what they are.
The only hint is syslog:
sm-mta[1180]: rejecting connections on daemon MTA-v4: load average: 32

sm-mta[1180]: rejecting connections on daemon MSP-v4: load average: 32

etc.

sm-mta[1180]: accepting connections again for daemon MTA-v4

sm-mta[1180]: accepting connections again for daemon MSP-v4
Supposedly these mean that mail server is not getting any messages, probably because the server load is high.
Other than that – no indication as to what exactly is failing.
Either way, it seems that will not be my main limiting factor anyway. Let’s try to to the same with a bit more content.
License.txt for starters.
This time, we get a bit different results:
Response Times: Average 45 ms, Min/Max 8 / 7984 ms
Response Counts: Success 318296 Timeout 0 400/500 0 / 0 Network 677
Bandwidth: Sent 34.93 MB Received 6.0 GB
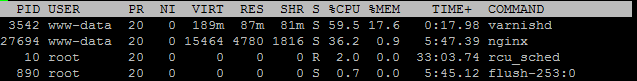
Much more bandwidth, and better response times. Some network errors. CPU is not any more pinned to 99% with varnishd but floats around 87%, probably loading disk or just being limited by the bandwidth.


Just to confirm that the bandwidth is the limiting factor I’ll run the test with twice bigger file. This time results are a bit cleaner:
Response Times: Average 87 ms, Min/Max 8 / 1617 ms
Response Counts: Success 169007 Timeout 0 400/500 0 / 0 Network 0
Bandwidth: Sent 18.59 MB Received 6.32 GB
Bandwidth graph is still limited at the same value (around 900 megabit/s), requests per second are twice lower. Times are more linear without jumps.

5.
Let’s try to make NGINX work harder (so far, varnish was serving these files before NGINX even needed to do anything). So, I switch off varnish and make NGINX listen to port 80. This way, NGINX serves small file directly. It seems NGINX does the job well. , here are the results:
Response Times: Average 21 ms, Min/Max 7 / 9974 ms
Response Counts: Success 641625 Timeout 0 400/500 0 / 0 Network 47
Bandwidth: Sent 91.07 MB Received 169.47 MB
NGINX alone handled 15% more requests, and got 10 times less errors – 47 instead of 405.
Now, let’s try to load the same 20k file with NGINX directly, here are the results:
Response Times: Average 44ms, Min/Max 8 / 3359 ms
Response Counts: Success 324928 Timeout 0 400/500 0 / 0 Network 82
Bandwidth: Sent 41.50 MB Received 6.11 GB
Results are quite similar, except NGINX does the heavy lifting (by the end of the test it was close to 99%) and network errors are much lower:


One observation we could make is that varnish is not as efficient at handling static files as NGINX. So, maybe let’s see how this works if varnish passes the files to NGINX, let’s start with small file:
Response Times: Average 53 ms, Min/Max 7 / 20060 ms
Response Counts: Success 221874 Timeout 134 400/500 0 / 0 Network 291
Bandwidth: Sent 31.44 MB Received 73.64 MB
Well, it looks like a bad idea. Just passing request from varnish to nginx increased the response time almost three times, and reduced the number of requests served by same factor.


Now let’s make some basic PHP file, with basic output, producing small file. Basic echo statement will do for now.
Response Times: Average 56 ms, Min/Max 7 / 8695 ms
Response Counts: Success 206112 Timeout 0 400/500 0 / 117 Network 23028
Bandwidth: Sent 31.28 Received 42.10 MB
Ok, we see some 500 errors, a lot (100 times more) of “Network errors”.
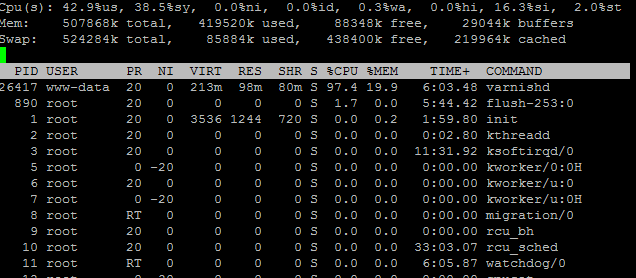
The top reveals that there’s a lot of PHP processes “Spawned”, I bet those are not very efficient:


While the Network errors are visible in general scale, 500 errors need some zoom:

As an experiment, I have changed some nginx settings – worker_processes to 1 from auto (there’s one processor on this box), and worker_connections to 1024 from 200… The results are not positive:
Response Times: Average 60 ms, Min/Max 7 / 7054 ms
Response Counts: Success 178212 Timeout 0 400/500 0 / 53357 Network 0

Let’s try to go other way, but keep one process. Adjusted worker_connections to 100 and kept the processes at 1.
Response Times: Average 58 ms, Min/Max 7 / 15300 ms
Response Counts: Success 199203 Timeout 0 400/500 0 / 229 Network 28334
With workers at 300, I get the following (which might be better, depending on further investigation):
Response Times: Average 66 ms, Min/Max 7 / 7325 ms
Response Counts: Success 204923 Timeout 0 400/500 0 / 12087 Network 682
I’ve run couple more tests, and it appeared that some where between 250 and 300 connections per worker, errors switch from Network errors to 500s, so I set it to 256 for worker_connections and try to find out what kind of errors we are getting.
Some of errors in NGINX error log were:
few of 200 worker_connections are not enough while connecting to upstream
many more
100 worker_connections are not enough while connecting to upstream
and a lot of
connect() to unix:/tmp/php5-fpm.sock failed (11: Resource temporarily unavailable) while connecting to upstream,
kern.log has the following line appearing many times:
TCP: Possible SYN flooding on port 80. Sending cookies. Check SNMP counters.
After a bit more tweaking, it seems that 256 connections, without multiconnect, and 10 PHP processes seems to be best for this kind of “artificial test”.
Response Times: Average 67 ms, Min/Max 7 / 7760 ms
Response Counts: Success 211774 Timeout 0 400/500 0 / 2 Network 786


Now, let’s get real and try to serve some WordPress homepage. Obviously, it will not be as easy as the echo command and some parameters might need to be tweaked again. Let’s start with up tp 50 persistent users, with 500, it gets overwhelmed with errors too early to complete the test. It seems that all the “extra” requests get piles into queue, just making response slower, because more requests are piled earlier, with the same number of requests served over the same time, for my homepage that’s 408 per minute or 6.8 per second.
Response Times: Average 3348 ms, Min/Max 139 / 6911 ms
Response Counts: Success 408 Timeout 0 400/500 0 / 2 Network 786
Bandwidth: Sent 46.07 KB Received 14.67 MB


Not using PHP 5.6 OpCache maxes out CPU with PHP processes and brings down maximum page loads to 116.
Now let’s try to improve the performance, rather than make it worse. Let’s enable APCu cache and set W3 Total Cache to use it for Page cache, minify cache (manual, as auto minify seems to always fail), and object cache.
Response Times: Average 99ms, Min/Max 9 / 470 ms
Response Counts: Success 30189 Timeout 0 400/500 0 / 0 Network 0
Bandwidth: Sent 2.98 MB Received 1.07 GB
Well, not bad result, actually, 74 times better than plain PHP with opcache.

Just using APCu object_cache.php drop-in makes it even worse, bringing throughput to 191 page loads – that’s more than twice worse than without it. Now, let’s try xCache in the same Object cache role with W3TC plugin.
Result is similar to APCu, with total throughput of 29982 pageloads (not even 1% difference).
I suspect the main difference is coming from the fact that we do not need to run the PHP processes at all. Page cache is taking care of complete page load. So, disabling the page cache confirms that throughput is at 376 pages.
Using object cache in W3TC only did not help much either – giving 370 page loads with APC and 373 with xCache.
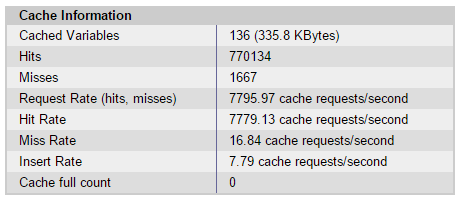
It looks like if Object cache would not work at all, or make things worse, so I have checked actual stats from APC after one run (using object cache with W3TC), and it seems to be working fine:
So, here’s the result, which is strange, on the one hand, it used cache – 28079 times, while missed cache 2005 times, cache was cleared before test, so all the variables should have been initialized while doing test, but there’s only 68 variables, so not clear what 2005 misses are about. Beside, insert rate is equal to miss rate, which means, each second, it was doing 23 requests that did not have results, and was storing new variables in cache… only to check for them next second, I guess, al that to produce ~370 page loads.

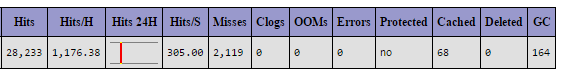
Using droping object cache for APCu, gives a bit different statistics, it stored twice the amount of variables, gets x20!!! times the hits, and has less misses – only 1667. It has twice less insert rate than miss rate.. and this produces 258 page loads… something is very wrong here as well.
Checking xCache stats for the run does not explain much either. We get same amount of variables, hits and misses, as with APC bundled with w3tc.
Using Supercache without any object caching gave 46746 pageloads, while using APC Object caching hardly changes it (after all, the pages were cached, so PHP was not used that much).
Let’s complete this run of tests with using varnish. First let’s use it without any caching plugins. This results in 83984 page loads. The best result so far, 2 .8 times better than full page cache with APC and x2 better than SuperCache full page caching.
Now, let’s try to combine two best approaches – WP Super Cache and Varnish. We get 82621 page loads, which is worse than Varnish alone. After all Varnish does not let WordPress to generate any pages, so it should not matter much if it gets cached before.
The absolute best result I was able to get is after using APCu + W3TC for Minification, Object cache and full page cache, and that was 86115 pageviews. That’s about 1500 page loads per second. My complete homepage weights 1.4Mb and just HTML is 37kb – 9.5Kb gzip compressed transfer.. And according to test, it transferred back 3.06 GB. If we divide 3.06 Gb by 86115 we get around 37Kb of data.. So it matches the “html only” transfer. To measure complete page serves, we should add some more requests, for main style, main javascript, and some images. Then those could be closer approximation to complete page loads, and would account for minification and other factors. Besides, we might load another page etc.